Reports
Generate, download, and track operational and financial reports on demand.
The Reports page lets you run reports from a catalog of templates, choose an output format, and download the result. Pick a template, fill in its parameters — such as a date range and customer — and the platform builds the file in the background for you to download.
The platform ships with five system report templates:
| Report | Category | Who can run it |
|---|---|---|
| Inbound Receiving Report | Receiving | Admin, Manager |
| Sales Report | Financial | Admin, Manager |
| Billing Report - Container Cost Breakdown by MBL | Financial | Admin |
| Customer Activity Summary (Monthly) | Performance | Admin, Manager |
| Customer Year-Over-Year Volume Comparison | Performance | Admin, Manager |
Beyond these, users with the report-creation permission can build their own custom templates (see Custom report templates).
On-demand only
Reports run when you generate them. There is no scheduled or automated report generation, and no email delivery — you run a report and download the file yourself from Execution History.
The reports page
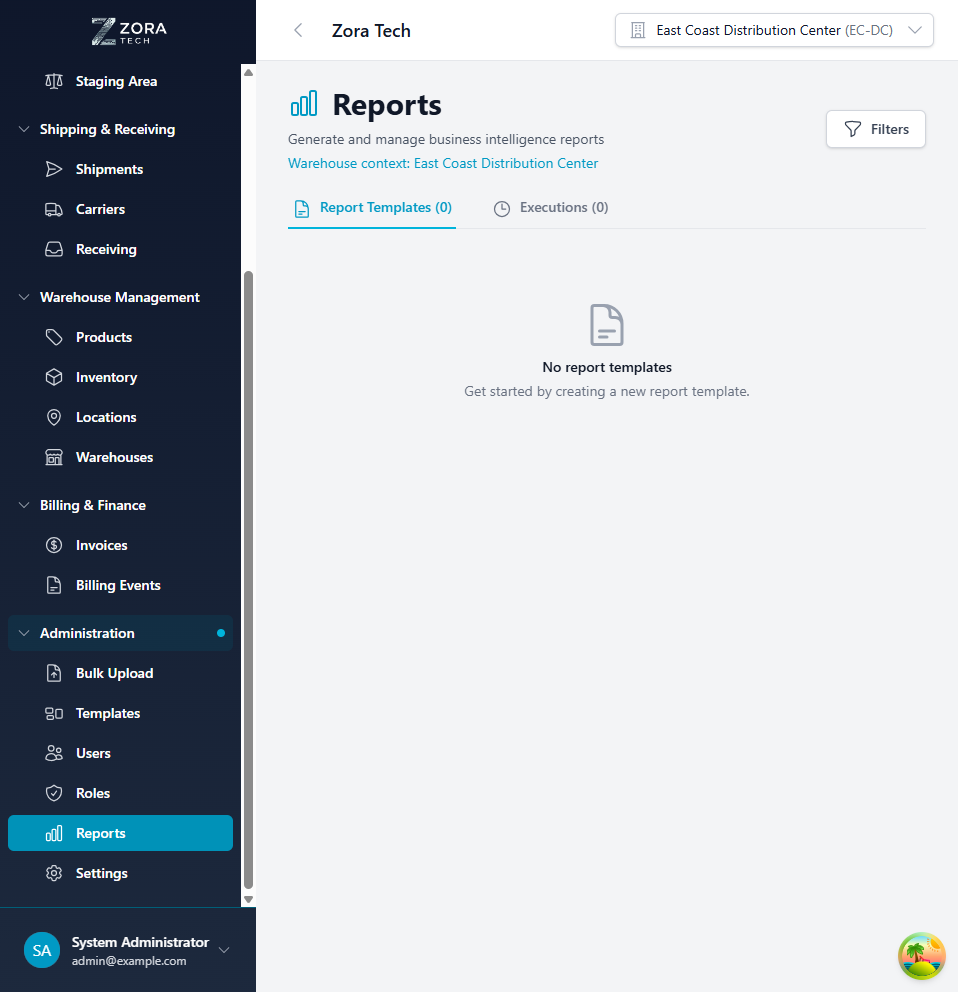
The page has two tabs:
- Report Catalog — a table of the templates you can run, each row showing its name, description, category, supported formats, and a System or Custom label. Search and filter to find one, then choose Generate.
- Execution History — every report you've run, with its status and a download link.
Summary cards at the top show your total templates, total executions, and how many have completed or failed.
Generating a report
- On the Report Catalog tab, find the template you want and choose Generate.
- In the Generate dialog, fill in the Parameters. These vary by template (see each report below) — typically a date range plus a scope filter such as customer or warehouse. Required parameters are marked.
- Choose an output format from the formats that template supports (PDF, Excel, CSV, or JSON).
- Choose Generate Report.
- The report is queued and runs in the background. Open the Execution History tab to watch its Status; when it reaches Completed, choose Download to save the file.
It runs in the background
You don't have to wait on the dialog — generation continues even if you navigate away. Come back to Execution History to grab the file.
System reports
Inbound receiving report
A proof-of-delivery document showing receiving order details, line items, and seal verification.
- Parameters: Customer, Date from, Date to (required together) — or an Equipment # to look up a specific load; Warehouse (optional).
- Key columns: RO Number, Customer, Carrier, Carrier Reference, Tracking Number, Equipment #, SKU, Product, Expected Qty, Received Qty, Received By, Received Date, Location, License Plate Number (LPN).
- Formats: PDF, Excel, CSV.
Sales report
An invoiced-revenue summary grouped by sales representative and customer account.
- Parameters: Date from, Date to (required); Sales Rep (optional).
- Key columns: Sales Rep, Customer, Customer #, Invoices, Revenue — with subtotals by sales rep.
- Formats: PDF, Excel, CSV, JSON.
Billing report - container cost breakdown by MBL
A billing report showing all costs per container, grouped by Master Bill of Lading (MBL). It pulls together billing charges, invoice line items, and freight costs for inbound receiving orders.
- Parameters: Customer, Date from, Date to (required); MBL Number and Warehouse (optional).
- Key columns: MBL #, Container #, RO #, Received, Source, Type, Description, Qty, Rate, Total — with container and MBL subtotals.
- Formats: PDF, Excel, CSV, JSON.
Customer activity summary (monthly)
Monthly inbound and outbound volume per customer — one row per customer per month in which that customer had activity.
- Parameters: Date from, Date to (required); Customer and Warehouse (optional).
- Key columns: Customer, Customer #, Month, Inbound Receipts, Inbound Containers, Inbound Lines, Inbound Units, Outbound Orders, Outbound Shipments, Outbound Lines, Outbound Units.
- Formats: PDF, Excel, CSV, JSON.
Customers and months with no activity are left out entirely — the report never pads the range out to a full month series and never lists a customer who did nothing. These are detail rows only; there is no subtotal or grand-total row.
Customer year-over-year volume comparison
Compares each customer's inbound and outbound volume for a target year against the prior year. One row per customer per month, plus a per-customer ** TOTAL ** row summarizing the full year.
- Parameters: Year (required); Customer and Warehouse (optional).
- Key columns: Customer, Customer #, Period, then Current, Prior, and Variance % for each of Inbound Receipts, Inbound Containers, Inbound Units, Outbound Orders, Outbound Shipments, and Outbound Units.
- Formats: PDF, Excel, CSV, JSON.
Variance is left blank when the prior-year value is zero — there's no percentage change to report from zero. The TOTAL row's variance is worked out from the summed annual figures, not averaged from the twelve monthly variances.
Export the year-over-year comparison to Excel or CSV
With 18 metric columns, this report is dense as a PDF. Excel and CSV are the practical choices.
How the volume counts are measured
Both customer activity reports count the same way:
- Inbound Containers counts only receiving orders whose equipment type is Container — a subset of Inbound Receipts. Sites that record inbound equipment as Trailer will see 0 in this column.
- Outbound Shipments counts distinct shipments for that customer. A shipment carrying several customers' orders counts once for each of those customers, so adding this column up across customers can exceed your true shipment count.
- Months are bucketed using the selected warehouse's timezone, or the global warehouse timezone setting when you leave the warehouse filter blank.
Reports respect each warehouse's timezone
Date-range filtering uses the configured timezone of the warehouse the data belongs to, so day boundaries match local operations.
Execution history
The Execution History tab lists your report runs, newest first. Each row shows the report name, format, status, when it started, and how long it took.
| Status | Meaning |
|---|---|
| Pending / Processing | The report is queued or currently generating. |
| Completed | The file is ready to download. |
| Failed | Generation failed — see the error and retry. |
Row actions depend on status:
- Download — available once a run is Completed.
- Retry — re-run a Failed report with the same parameters.
- Delete — remove an execution record (not available while it's still pending or processing).
Output formats
| Format | Best for |
|---|---|
| Print-ready, formatted documents and client-facing copies. | |
| Excel (.xlsx) | Further analysis and manipulation in a spreadsheet. |
| CSV | Importing into another system or scripting against the raw data. |
| JSON | Programmatic consumption and integrations (supported by every system report except Inbound Receiving). |
Each template supports a specific subset of these formats, shown on its catalog card and in the Generate dialog.
Custom report templates
In addition to the system templates, the platform supports custom report templates for users with the report-creation permission. These are managed through the platform's reporting API rather than from the Reports page. A custom template:
- is defined by its name, description, category, parameters, output fields, supported formats, and a SQL query — queries are read-only, so write operations and other unsafe SQL are rejected;
- can be cloned from any existing template (including a system one) as a starting point;
- can be previewed against sample rows before it's saved;
- can be deleted by its owner, while the five system templates are protected.
Once created, a custom template appears in the Report Catalog with a Custom label and runs exactly like the system reports.
Troubleshooting
A report failed
Open the run on Execution History to see the error message, then choose Retry. If it fails again, narrow the parameters (for example, a shorter date range) and run it once more.
A large report is slow
Reports generate in the background, so you can keep working and come back to Execution History. To speed things up, tighten the date range or add a customer/warehouse filter to reduce the amount of data.
A report isn't in the catalog
Check, in order:
- Your role can run it. The Billing Report - Container Cost Breakdown by MBL is Admin-only; the receiving, sales, and customer activity reports need Admin or Manager.
- You're on the Report Catalog tab, not Execution History.
- No category filter is hiding it — clear the filter and search again.