Understanding your dashboard
Read the six metric cards, the notification bell, and the alert panels on your dashboard, and use the shortcuts to get straight to work.
Dashboard overview
When you sign in, you land on the dashboard: your warehouse's key metrics and recent activity in one place.
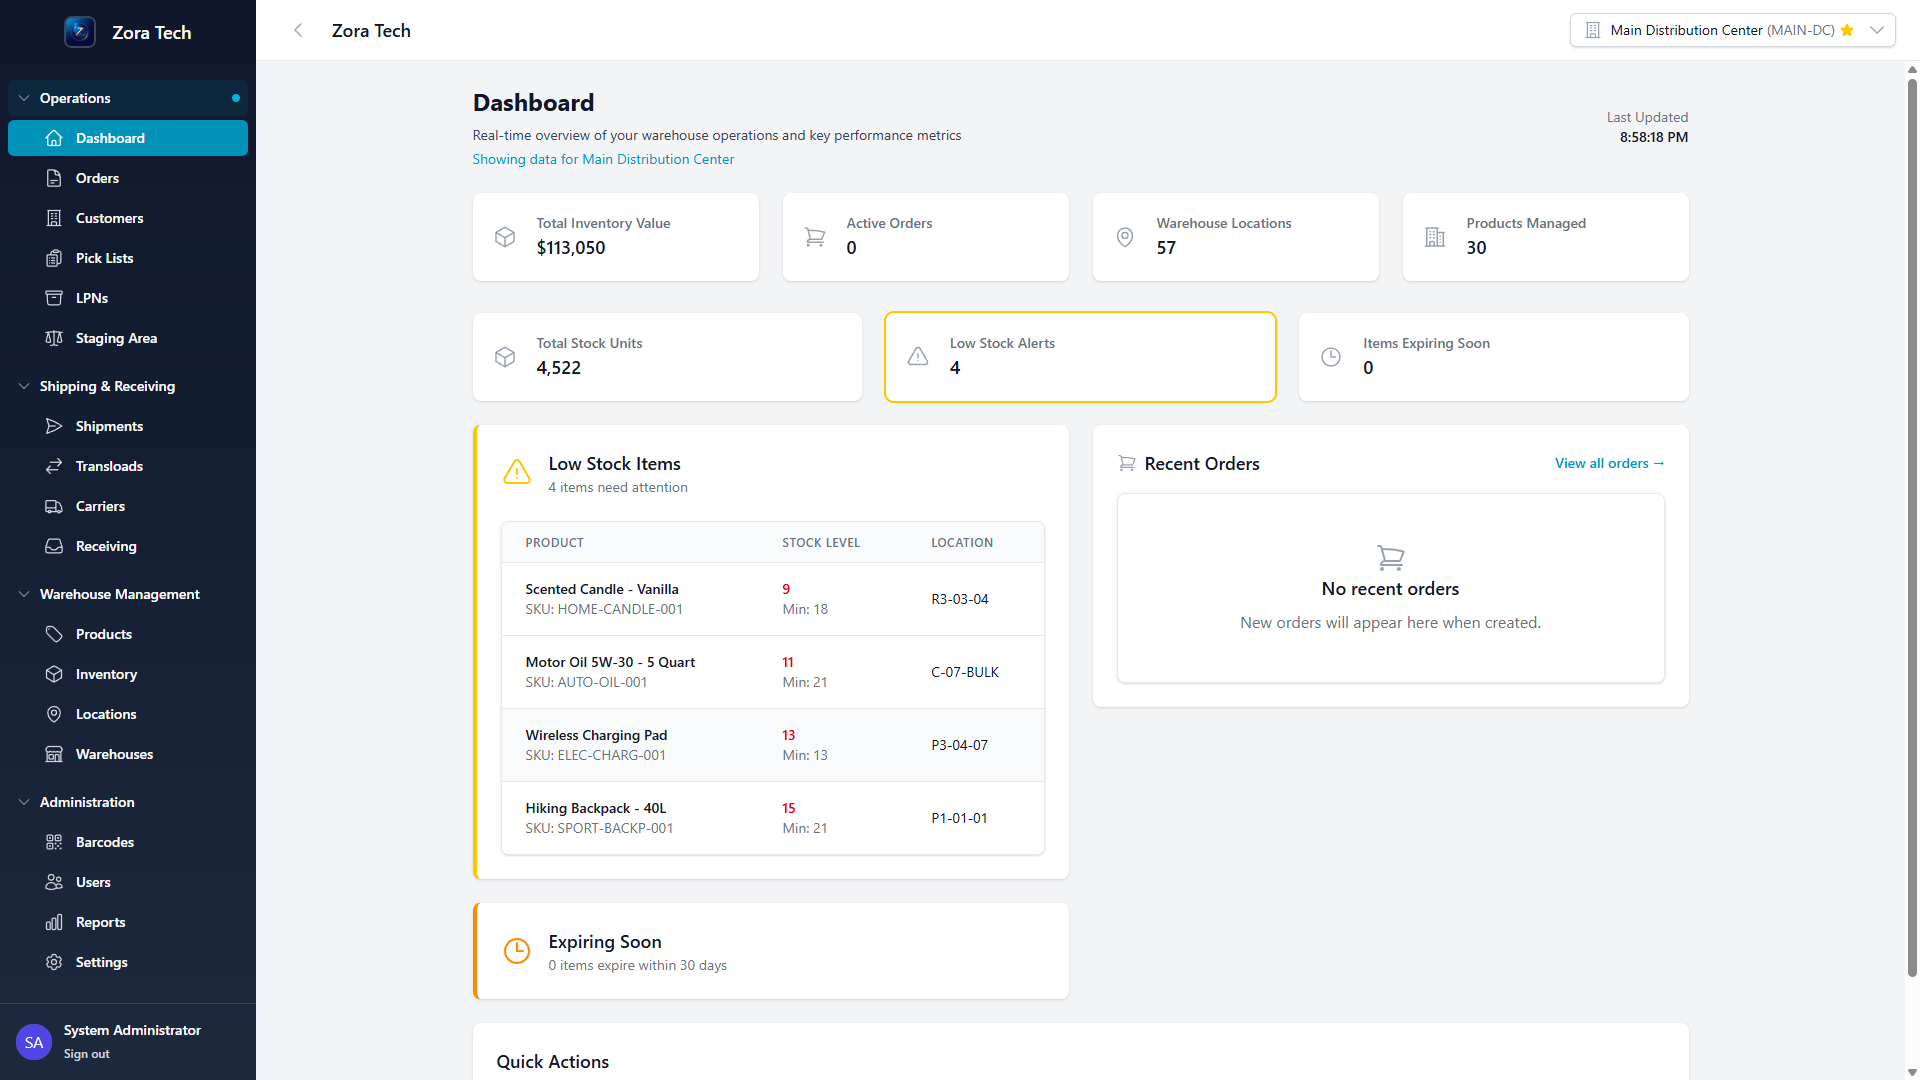
Key metrics cards
Six cards sit at the top of the page, in two rows of three. They describe what is in the warehouse right now.
| Card | What it shows | Why it matters |
|---|---|---|
| Total Inventory Value | Sum of all product quantities × unit cost, across the warehouses in scope | Tracks your total inventory investment. Watch it over time to spot over- or understocking |
| Warehouse Locations | Count of storage locations in scope — not a count of warehouses | Gauges the size of the operation you're looking at. Read alongside Locations when planning space |
| Products Managed | Count of distinct SKUs in your product catalog | Tracks catalog growth and product diversity |
| Total Stock Units | Total quantity on hand across every product — units, not value | Read next to Total Inventory Value to separate volume from price. Spot large swings after big receipts or shipments |
| Low Stock Alerts | Count of products below their reorder point | Prevents stockouts. The Low Stock Items panel further down the page lists them |
| Items Expiring Soon | Count of lot-tracked stock expiring within the next 30 days | Move short-dated stock before it's written off. The Expiring Soon panel further down names the products and dates |
Warehouse KPI sections
Below the cards, three sections roll up what the warehouse has actually done.
These need the View warehouse KPI dashboard permission (dashboard:view). If your role does not have it, the three sections are hidden rather than shown empty — see Roles & Permissions.
Today's activity
Four tiles counting today's work, each showing the same measure over the last 7 days beneath it: Shipments Created, Shipments Dispatched, Units Received and Open Orders.
Open Orders is the exception. It is a live total of the orders the warehouse still owes work on, counted across the whole order book — so it does not reset at midnight and carries no 7-day figure.
Picking & containers
Six tiles covering pick productivity and container use: Picks Completed, Picks / Hour, Avg Pick Time, Throughput, Active LPNs and LPN Utilization.
Last 14 days
Three charts plotting one point per day, oldest first, with the period total above each: Shipments Created, Picks Completed and Units Received.
Warehouse-local days, and a dash is not a zero
"Today" means the calendar day in the warehouse's own timezone, not yours. The rate tiles show — rather than 0 when there is nothing meaningful to divide yet — for example before the first pick of the day completes. Dashboard Metrics defines every tile in full.
Warehouse selector
The warehouse selector, at the top of the page, filters everything you see to one warehouse.
- Choose the warehouse dropdown in the top navigation.
- Select a warehouse to see only its data.
- Choose All Warehouses to see combined data across every location.
Warehouse context
Your warehouse selection persists across sessions. Zora remembers your last selection when you sign back in.
Notification center
The bell icon sits in the top bar, immediately left of the warehouse selector. It tells you when something has happened that needs your attention — most often that a pick list is finished and an order is ready to be loaded.
Reading the bell
- A badge on the bell shows how many notifications you have not read yet. Counts above 99 display as
99+. - Click the bell to open the panel. Each entry shows a title, a short description and when it arrived, with unread entries marked.
- The list is scoped to your user and your currently selected warehouse. Notifications are personal: another user's bell shows their own list, and switching warehouses changes what you see.
- The bell refreshes itself about every 30 seconds, so a new notification appears within roughly half a minute without reloading the page. When one arrives while you are working, a toast also appears briefly in the corner.
Acting on a notification
- Click a notification to open the record it refers to. A completed pick list, for example, takes you to shipment creation so you can load the order.
- Clicking also marks that notification as read, clearing it from the count.
- Mark all as read at the top of the panel clears the badge in one step.
Read, not deleted
Notifications are marked read rather than deleted, and there is no manual delete. Pick-complete notifications also clear themselves once the order they refer to has been added to a shipment — so an item that no longer needs action disappears on its own.
What triggers a notification
| Notification | Raised when | Goes to |
|---|---|---|
| Pick List Completed | A picker finishes a pick list | Admins and managers for that warehouse |
| Delivery Request Submitted | A customer submits a delivery request in the portal | Users whose role is set to receive delivery request notifications |
| Delivery Request Status Changed | A request moves to a new status | The user who raised the request |
| Product Submission Created | A customer submits a product for review | Admins and managers for that warehouse |
| Product Submission Approved / Rejected | You approve or reject a submitted product | The user who submitted the product |
Pick List Completed and Product Submission Created go to active users with the Admin or Manager role who have access to the warehouse in question — either because they are not restricted to specific warehouses, or because their warehouse access includes that one. Pickers are not notified of their own completed picks.
Delivery Request Submitted works differently: it is driven by a per-role setting rather than by role name. A user receives it when their role is flagged to receive delivery request notifications, they are active, and their warehouse and customer access both cover the request. If the right people are not being notified, that role setting is the thing to check — see Roles & Permissions.
One notification per pick list
Each pick list produces at most one notification per recipient, even if the completion event is processed more than once, so the bell will not fill up with duplicates.
If the bell shows nothing
- Confirm you are on the right warehouse — the list follows the warehouse selector.
- Pick-complete and product-submission notifications require the Admin or Manager role. If you have a different role, you will not receive them.
- Delivery request notifications depend on a setting on your role rather than on the role's name.
- Wait up to 30 seconds, or reload the page, for a very recent event.
See Pick Lists for the work that raises these notifications, and Delivery Requests and Product Submissions for the other sources.
Not email or SMS
These are in-app notifications only. There are no per-user email, SMS or push notification preferences to configure — see System Settings.
Navigation sidebar
The left sidebar gives you access to every platform feature, grouped into sections.
| Section | Contains |
|---|---|
| Dashboard | The main overview — this page |
| Order Fulfillment | Orders, Pick Lists, Load Planning, Staging Area, Shipments |
| Inventory | Receiving, Inventory, LPNs, Serial Lookup |
| Catalog | Products, Customers, Suppliers, Locations, Warehouses, Carriers |
| Freight Forwarding | Rate Quotes, Doc Receipts, Carrier Shipments |
| Billing | Invoices, Billing Events (feature-gated) |
| Administration | Users, Roles, Reports, Templates, Bulk Upload, Settings |
Alerts and recent orders
The lower half of the dashboard is split in two: a column of alert panels on the left, and the Recent Orders table on the right.
Alert panels
| Panel | What it lists |
|---|---|
| Low Stock Items | The first five products below their reorder point, with a link to the rest |
| Expiring Soon | The first three lots expiring within 30 days, with product, SKU, date and quantity |
| Pending Shipments | Shipments awaiting dispatch |
| OS&D Discrepancies | Recent receiving discrepancies — over, short and damaged |
Each panel shows a count in its subheading even when it has nothing to list, so an empty panel means "nothing to act on" rather than "not loaded".
Recent orders
The most recent orders for the selected warehouse, up to eight rows, with columns for Order Details (order number and customer), Status, Priority and Created. View all → opens the full Orders list.
It is a table, not an audit trail
Recent Orders is a view of the orders themselves, not a feed of system events. The dashboard does not show user administration, permission changes or other system activity — for that history, see Reports.
Quick actions
A Quick Actions card at the bottom of the dashboard holds four buttons: Add Inventory, Create Order, Manage Locations and View Reports. Each is a shortcut to the matching page.
Mobile dashboard
The dashboard adapts to a phone screen.
| On mobile | What happens |
|---|---|
| Metric cards | The card grid drops to two columns and wraps, so every tile stays on the page |
| Tables | Recent Orders and Low Stock Items switch from columns to stacked cards, showing the higher-priority fields first |
| Navigation | Collapses into a hamburger menu |
| Touch targets | Large buttons, sized for warehouse use |
- Add the app to your home screen for a full-screen view. See Installing as an app.
- Tap the menu icon (☰) to open navigation.
- Scroll to reach every metric — the cards wrap rather than scrolling sideways.
- Use the Quick Actions card for common tasks.
Dashboard customization
Warehouse preferences
Set your default warehouse for automatic selection:
- Go to User Profile (click your name in top right)
- Select Preferences
- Choose Default Warehouse
- Save changes
Notification preferences
There are none to configure. Notifications are delivered in the app only, through the Notification Center described above, and every user who qualifies for a notification receives it. There are no per-user toggles for order status changes, low stock, email, SMS or push.
What you receive is determined by your role and your warehouse and customer access rather than by a personal preference — see What triggers a notification.
Understanding metric trends
How to read trends
No card on the dashboard shows a green or red arrow, or a percentage change against a previous period. There are two places to read movement instead:
- The footnote under a tile — "84 in the last 7 days" beneath today's figure. Compare the two yourself: today well below a seventh of the 7-day total is a slow day.
- The Last 14 Days charts — the shape of the line over a fortnight, plus the period total above each chart.
Common patterns
| Pattern | Might mean | What to do |
|---|---|---|
| Inventory value increasing | More products received than shipped | Could be healthy growth, or overstocking — check which |
| Open orders growing | Business growth, or a processing bottleneck | Watch pick rates and fulfillment times |
| Product count stable | A consistent catalog size | Normal for an established operation |
Common dashboard tasks
Receive shipments
- Choose Receiving in the sidebar.
- Select or create a receiving order.
- Scan items and enter quantities.
- Complete the receipt.
Process orders
- Choose Orders in the sidebar.
- Review pending orders.
- Generate pick lists.
- Start picking.
Check inventory
- Choose Inventory in the sidebar.
- Search or filter for what you need.
- Check stock levels by location.
- Make an adjustment if the count is wrong.
Run reports
- Choose Reports in the sidebar.
- Select the report type.
- Apply a date range and filters.
- Export or review the results.
Keeping an eye on the dashboard
Daily routine
| When | What to check |
|---|---|
| Morning | The Open Orders count. Any alerts or notifications. Expected shipments in the receiving queue |
| Through the day | Order processing progress. Inventory levels for popular items. Respond to low stock alerts |
| End of day | That every order shipped. Today's Activity and the Recent Orders table. Tomorrow's workload |
Weekly and monthly checks
| Frequency | What to review |
|---|---|
| Weekly | Order volume trends. Inventory turnover. Fulfillment metrics |
| Monthly | Inventory value trends. Product catalog growth. Location count trends |
Troubleshooting
| Problem | What to check |
|---|---|
| Metrics not updating | Wait for the next refresh, or reload the page to refresh every group at once. Each group refreshes on its own timer, from 1 minute for Recent Orders to 15 minutes for the trend charts. See Dashboard Metrics |
| Wrong warehouse showing | Use the warehouse selector to change it. Zora remembers your last selection |
| Can't see certain metrics | Ask an administrator to grant your role the View warehouse KPI dashboard permission (dashboard:view). Without it, Today's Activity, Picking & Containers, and Last 14 Days are hidden entirely |
| Dashboard slow to load | Check your internet connection. A large data volume or a network issue can also cause this |
Next steps
| You want to… | Start here |
|---|---|
| Process incoming shipments | Receiving |
| Fulfill customer orders | Order processing |
| Track and adjust stock | Inventory management |
| Analyze performance | Reports |