Dashboard metrics
See what each number on your dashboard counts, how often it refreshes, and what it leaves out.
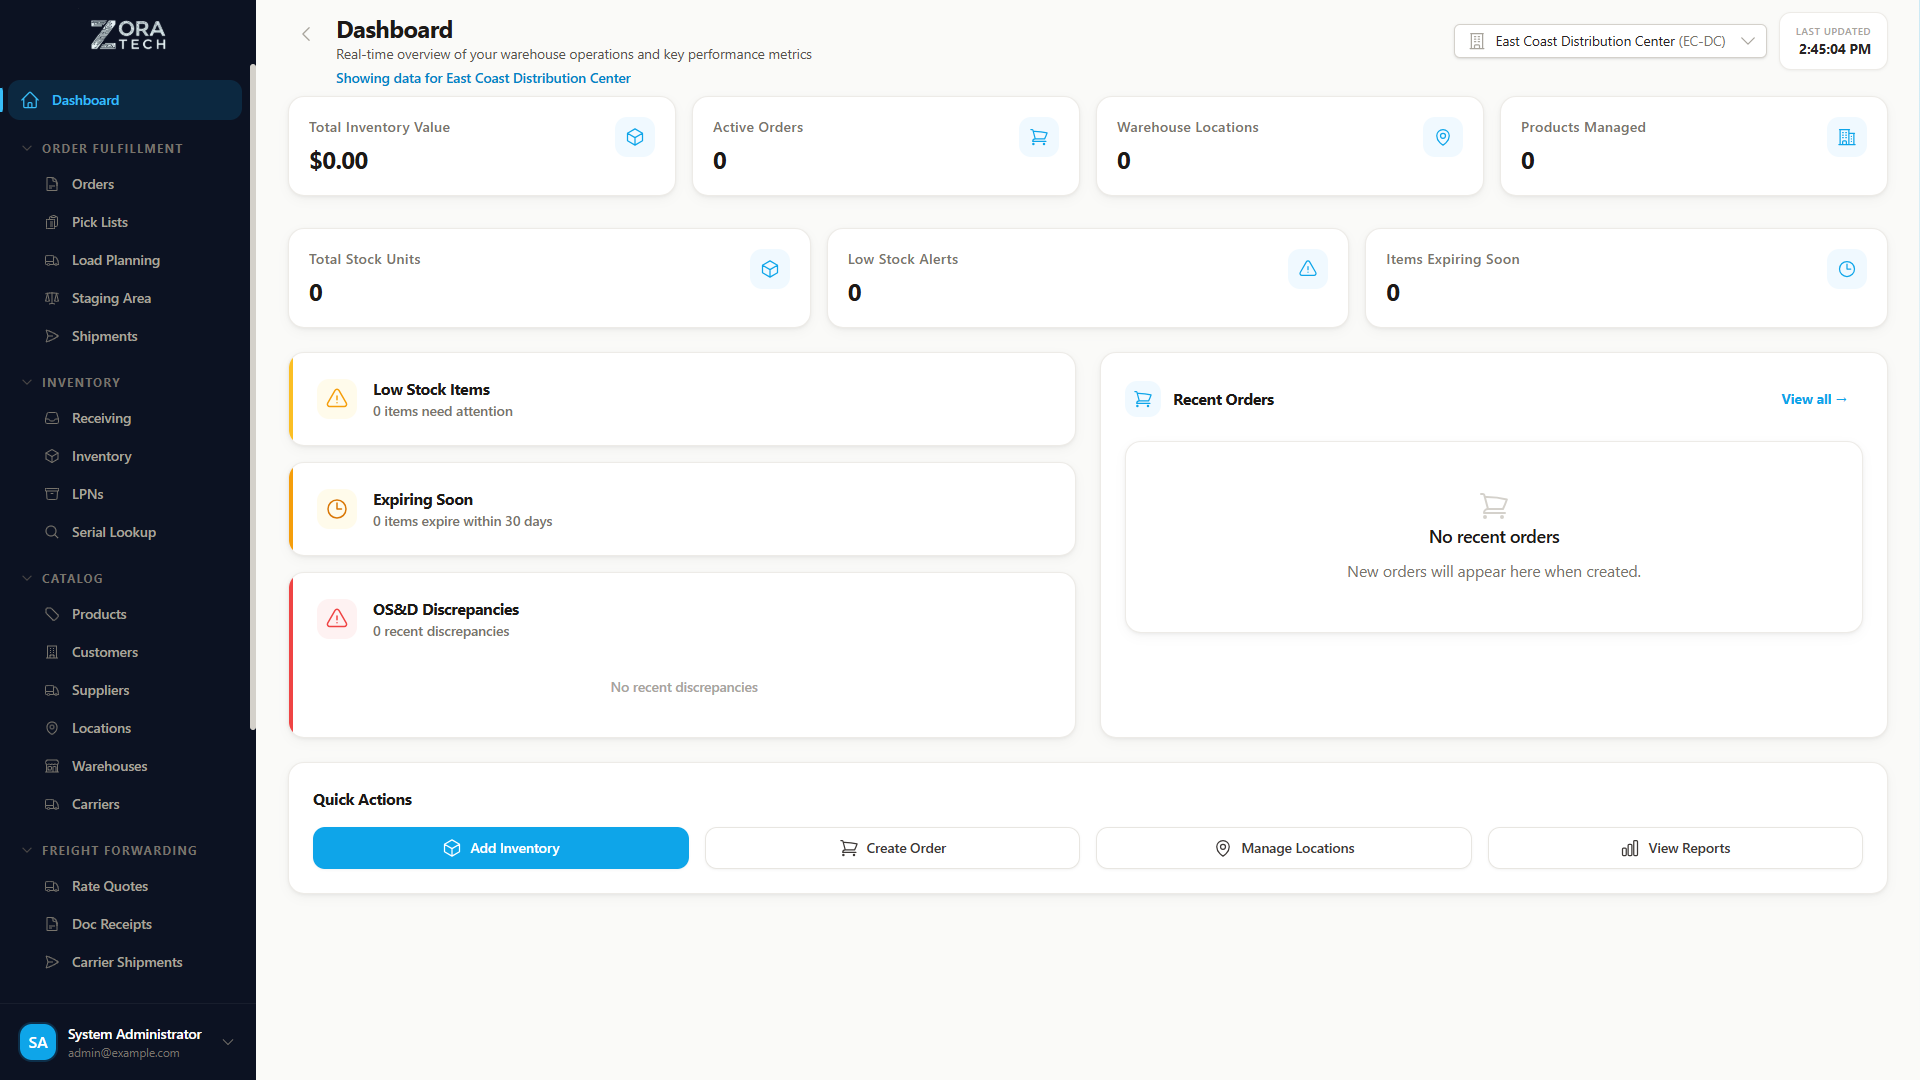
How the dashboard refreshes
The dashboard is not a single report. Each group of cards is loaded separately and refreshes on its own timer, so the numbers on screen can be a few minutes apart in age. You do not need to reload the page — each group updates itself in place.
| Cards | Refreshes every |
|---|---|
| Recent Orders table | 1 minute |
| Total Inventory Value, Warehouse Locations, Products Managed, Total Stock Units | 2 minutes |
| Today's Activity and Picking & Containers tiles | 2 minutes |
| Low Stock Alerts | 3 minutes |
| Recent receiving discrepancies | 3 minutes |
| Items Expiring Soon | 10 minutes |
| Last 14 Days trend charts | 15 minutes |
If a number looks stale
Give it up to the interval above before treating it as wrong. Reloading the page refreshes every group at once.
Warehouse scoping
Every metric follows the warehouse selector in the top bar. Selecting a warehouse re-loads all cards scoped to it; with no warehouse selected, the cards cover every warehouse you have access to. Changing the selector refreshes the data immediately rather than waiting for the next interval.
Primary metrics
| Metric | What it counts | What it doesn't |
|---|---|---|
| Inventory Value | Quantity × unit cost, summed across every product in the warehouses you can see | Any other point in time — it's a snapshot of right now, not a trend |
| Products Managed | The number of distinct SKUs in your catalog | Stock levels or sales — just how many products exist |
| Warehouse Locations | The number of storage locations across the warehouses in scope | How full those locations are |
Accuracy depends on your data
Inventory Value is only as good as your product costs and counted quantities. Regular cycle counting keeps it accurate.
Secondary metrics
| Metric | What it counts | What it doesn't | What to do |
|---|---|---|---|
| Total Stock Units | Total quantity on hand, across every product | Value — pair it with Inventory Value for that | Watch for large swings after big receipts or shipments |
| Low Stock Alerts | Products below their reorder point | — | Review and reorder |
| Items Expiring Soon | Lot-tracked stock expiring in the next 30 days | Lots already past their expiry date, or expiring after 30 days | Move short-dated stock first, or allocate the affected lots |
Today's activity
Four tiles counting what the warehouse has done so far today, each with the same measure over the last 7 days beneath it.
| Tile | What it counts |
|---|---|
| Shipments Created | Shipments created today |
| Shipments Dispatched | Shipments dispatched today |
| Units Received | Units received today |
| Open Orders | Orders the warehouse still owes work on — a live total, not a daily count |
Open Orders is every order whose status is not DISPATCHED, IN_TRANSIT, SHIPPED, DELIVERED or CANCELLED. It is a point-in-time figure counted across the whole order book, so unlike the other three it does not reset at midnight and has no 7-day line.
Days are warehouse-local, and include today
"Today" is the calendar day in the warehouse's own timezone, not yours and not UTC. "Last 7 days" means seven calendar days including today, so the 7-day figure is always at least the today figure. The heading above the tiles names the timezone the boundaries were drawn in and the time the roll-up was computed.
Picking & containers
| Tile | What it shows |
|---|---|
| Picks Completed | Pick lists completed today, with the 7-day total beneath |
| Picks / Hour | Pick lists completed today ÷ hours elapsed since warehouse-local midnight |
| Avg Pick Time | Mean minutes between start and completion, over pick lists completed today |
| Throughput | Units picked today ÷ hours elapsed since warehouse-local midnight |
| Active LPNs | Containers currently committed to work, with the in-service fleet size beneath |
| LPN Utilization | Active LPNs as a percentage of the in-service fleet |
The rates are day-to-date, not per-worker and not per-shift. The platform does not track shift schedules, so Picks / Hour and Throughput divide by wall-clock time since midnight rather than by labour hours. Early in the day they move sharply; they settle as the day fills in.
LPN Utilization answers "how much of my container fleet is tied up?", not how full each container is. Dispatched, shipped, consolidated and out-of-service containers are excluded from both sides of the ratio, so retired containers do not ratchet the number upward over time.
A dash means 'no reading yet', not zero
A tile shows — when there is nothing meaningful to divide: no pick has completed yet today, less than fifteen minutes have elapsed since warehouse-local midnight, or the warehouse has no in-service containers. The dashboard deliberately does not print 0 for a rate it cannot compute.
Last 14 days
Three charts plot one point per warehouse-local day, oldest first, with the period total above each: Shipments Created, Picks Completed and Units Received. Quiet days are plotted as zero rather than skipped, so a flat stretch is real inactivity and not a gap in the data. The same series is available to screen readers as a table.
Metric trends
Where to read a trend
No card on the dashboard shows a green/red arrow or a percentage change. There are two places to see movement instead:
- The footnote under a tile — "84 in the last 7 days" beneath today's figure. Compare the two yourself: today well below a seventh of the 7-day total is a slow day.
- The Last 14 Days charts — the shape of the line over a fortnight, plus the period total.
What a trend might mean
A number moving on its own doesn't tell you whether that's good or bad — read it against what's normal for your warehouse.
| If this rises | Could mean | Or could mean |
|---|---|---|
| Inventory Value | Business growth, seasonal stock-up | Overstocking, slow-moving stock |
| Open Orders | Business growth, high demand | A processing bottleneck or staff shortage |
| If this falls | Could mean |
|---|---|
| Picks / Hour | Training needed, or a layout problem — unless order complexity also went up, which slows picking without anything being wrong |
Time windows
The dashboard has no date-range picker. There is no Today / This Week / Last 30 Days selector and no custom range — every figure on the page is fixed to a window the platform chooses, and nothing on screen changes it.
| What you are looking at | Window it covers |
|---|---|
| Total Inventory Value, Warehouse Locations, Products Managed, Total Stock Units, Low Stock Alerts | Current state — a snapshot of now, not a period |
| Items Expiring Soon | The next 30 days |
| Today's Activity | The warehouse's local calendar day, from local midnight |
| Picking & Containers | Current state; the per-hour rates are measured from local midnight |
| Last 14 Days | The last 14 warehouse-local calendar days, including today |
The only control that changes what the dashboard covers is the warehouse selector in the top bar — see Warehouse Scoping above.
To analyse a specific period, run a report instead. The system report templates take From Date and To Date parameters — see Reports.
Exporting metric data
There is no page-level export on the dashboard — no PDF report, no CSV of the whole page, and no scheduled email delivery. What you can export are the two tables.
Exporting a dashboard table
Both Low Stock Items and Recent Orders export to CSV:
- Right-click any column header in the table to open the column menu.
- Click Export CSV (visible columns) at the bottom of the menu.
- The file downloads immediately as
zora-dashboard-low-stock-<timestamp>.csvorzora-dashboard-recent-orders-<timestamp>.csv.
Columns you have hidden from that same menu are left out of the file, so hide what you don't need before exporting.
The export contains only the rows on screen
The dashboard truncates both tables — 5 low-stock rows and 8 recent orders — and the export takes exactly the rows the table was given, not the full result set. For the complete inventory list, open Inventory, where the same menu offers Export All Rows (CSV) instead.
Metric accuracy
A metric is only as accurate as the data behind it.
| Do this | Because |
|---|---|
| Complete receiving promptly | Delayed receiving understates Inventory Value and stock counts |
| Record shipments immediately | Missed shipments leave Open Orders overstated |
| Run regular cycle counts | Skipped counts let discrepancies drift over time |
| Keep product costs current | Stale costs skew Inventory Value |
| Process adjustments the same day they happen | — |
Metrics the dashboard does not show
Some figures people expect on a warehouse dashboard are not on this one. They are listed here so you can stop looking for them, and so you know where to get the same answer today.
| Not on the dashboard | Where to get it instead |
|---|---|
| Pick rate per worker | The dashboard's Picks / Hour is warehouse-wide. For per-picker figures, picker attribution is recorded on each pick — see Pick Lists |
| Order fill rate | Derive from order status in Reports |
| Pending receipts count | The receiving queue itself — see Receiving |
| Inventory turnover, order cycle time, putaway efficiency, warehouse utilisation, cost per order, return rate | Not calculated anywhere in the platform today |
If you cannot see the KPI sections at all
Today's Activity, Picking & Containers and Last 14 Days are gated on a dashboard:view permission. All four internal system roles hold it — Administrator, Manager, Worker and Viewer — and custom roles that already had reporting access were granted it too. Customer Viewer is deliberately excluded: these roll-ups aggregate every customer in the warehouse into one number, so no customer-portal role may hold them.
A role without the permission does not see those three sections; the rest of the dashboard still loads normally. Grant it on the Roles page.
For anything above that the dashboard cannot answer, the Reports module is the place to look — it ships customer activity, sales, inbound receiving and MBL billing reports.
Related guides
Need more help? Email support@zoratech.io, or check the FAQ.